In a world where technology reigns supreme, one of the most profound tools in medicine remains the irreplaceable electrocardiogram (ECG). This noninvasive method provides a graphical visualization of millivolt potentials received by electrodes located on the patient’s skin. It can measure many aspects, from how fast the heart beats to how well its chambers conduct electrical energy.
Resting ECG and long-term electrocardiographic monitoring are among the most commonly performed tests in cardiology. Prolonged ambulatory ECG monitoring, commonly referred to as Holter testing, increases the chance of detecting abnormalities responsible for the symptoms of cardiovascular diseases, especially those whose pathognomonic symptoms occur only periodically. As technology advances, so too does our ability to capture the heart’s rhythm with greater precision. Cardiomatics, as a leading AI-powered ECG interpretation software, represents a breakthrough in cardiac diagnostics, offering physicians a fast insight into heart’s health through meticulous anomaly detection and comprehensive reporting. By understanding the nuances of abnormalities detected in Cardiomatics and interpreting detailed reports, healthcare professionals can intervene promptly to prevent adverse outcomes.
Interpreting the waves and detecting abnormalities:
Typically, the heart conducts electricity in a pathway starting in the sinoatrial node (SA), our heart’s “natural pacemaker”, located in the wall of the right atrium. The electrical impulse goes further to the atrioventricular (AV) node, whose role is to slow down the conduction from the atria to the ventricles long enough for atrial contraction to occur. This allows the atria to fill the ventricles and achieve the highest possible stroke volume. Then, the current flows to an area known as the bundle of His, which divides into two branches (LBB and RBB) and is the only physiological pathway connecting the atria with the ventricles. The left bundle and right bundle terminate in the Purkinje fibers. The Purkinje system is made up of cells located just beneath the endocardium. These cells directly stimulate the myocardial cells and start the ventricular depolarization cycle.
Any disruption with the flow can affect the heart’s ability to work well and Holter monitors can measure those potential disruptions.
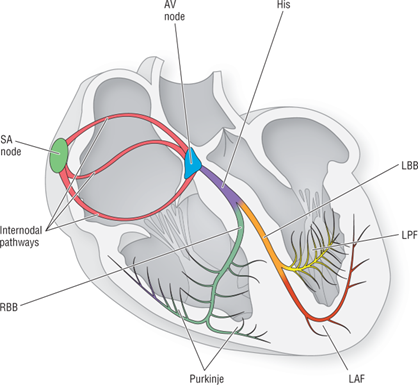
The electrical conduction system [1]
In schematic depiction of a normal sinus rhythm the P-wave represents atrial depolarization, the QRS complex symbolizes ventricular depolarization, and the T-wave indicates ventricular repolarization.
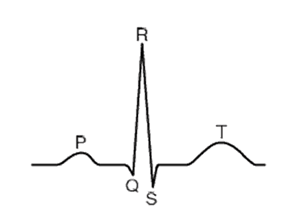
ECG waveform
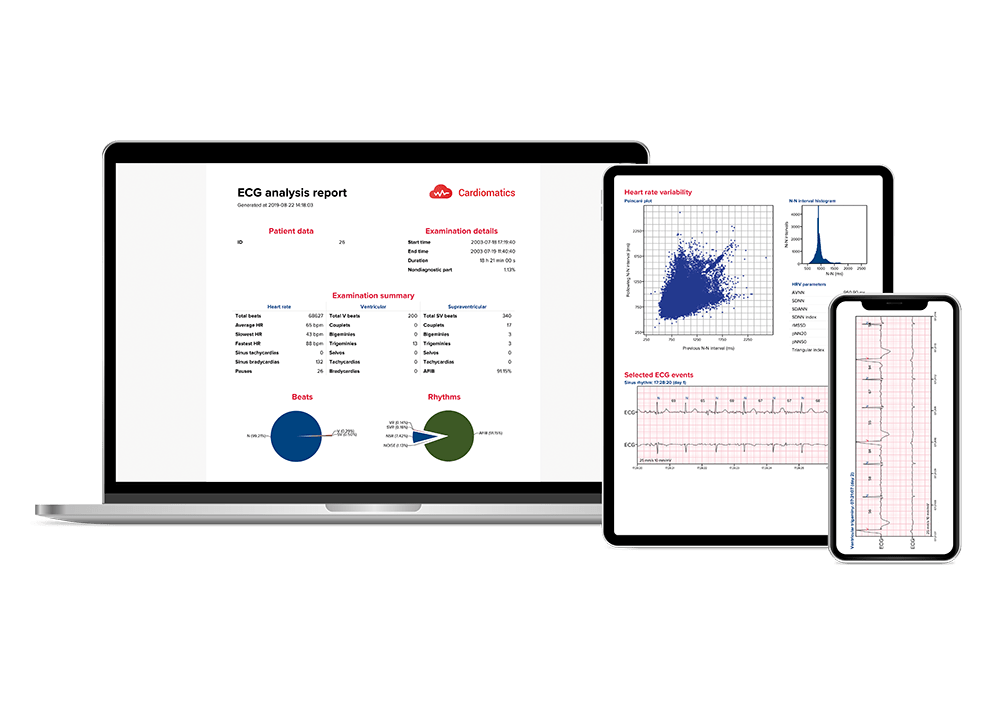
Cardiomatics provides a comprehensive analysis of long-term ECGs, covering over 26 heart-rate patterns and arrhythmias, hourly burden statistics, heart-rate variability and more. See below the Cardiomatics catalog of ECG events.
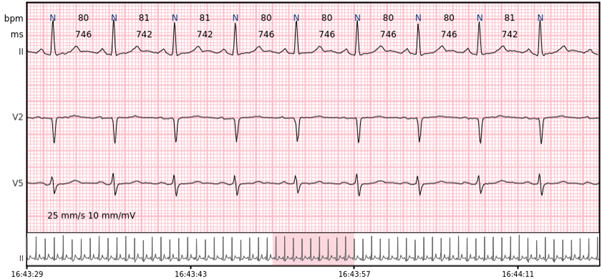
Sinus rhythm – the normal heart rhythm is the sinus rhythm generated by the physiological pacemaker, the sinus node.
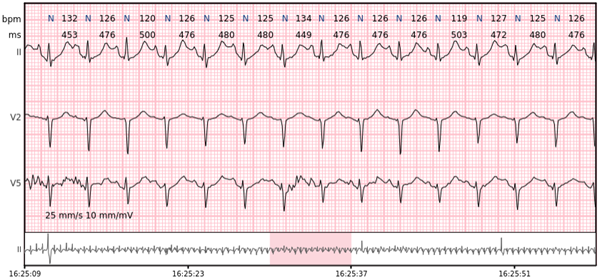
Sinus tachycardia – sinus rhythm above 100 bpm is a sinus tachycardia. In healthy individuals occurs during exercising or strong emotions. Usually does not exceed 160 bpm.
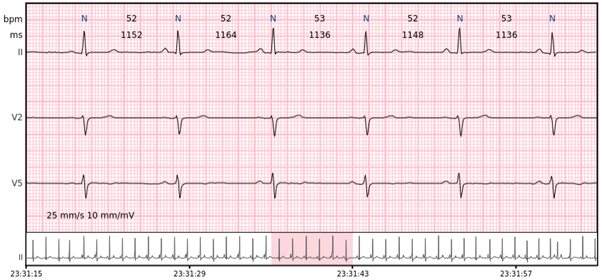
Sinus bradycardia – sinus rhythm below 60 bpm is a sinus bradycardia. In healthy individuals occurs during sleep, but can also be observed in athletes. Usually no slower than 40-45 bpm.
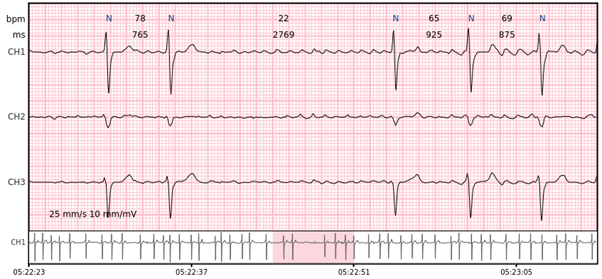
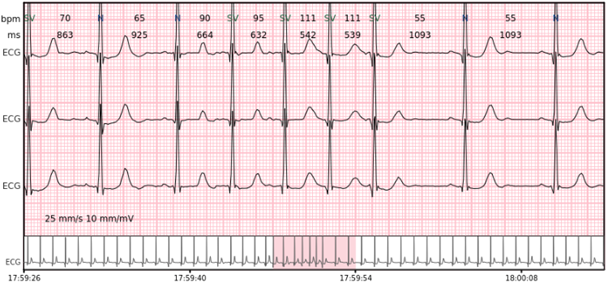
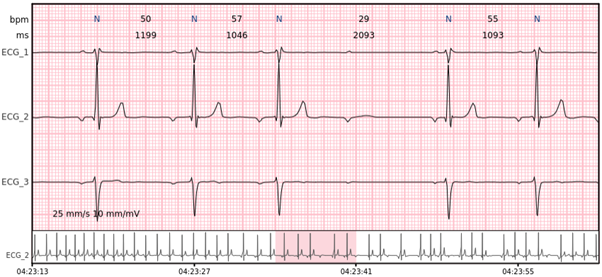
Pause – a prolonged R-R interval that represents the interruption in ventricular depolarisation. Minimal pause duration marked in Cardiomatics is 2000 ms.
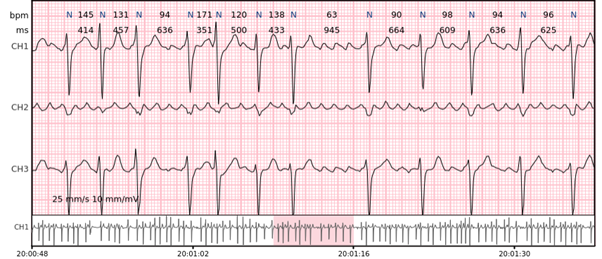
Ventricular beats – complexes originating within ventricles. Disturbed depolarization pathway leads to extended (~ 120 ms) QRS complexes with different morphology.
Ventricular couplet – two ventricular beats in a row.
Ventricular bigeminy – every other beat is a ventricular beat.
Ventricular trigeminy – every third beat is a ventricular beat.
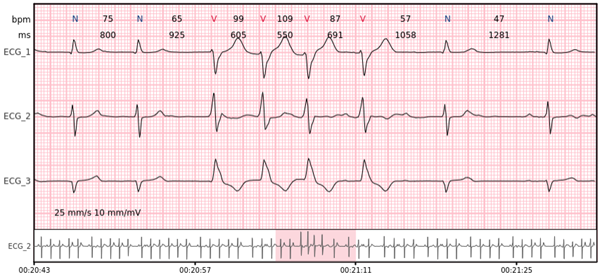
Ventricular salvo – 3-7 consecutive complexes of ventricular beats at a rate of > 100 bpm.
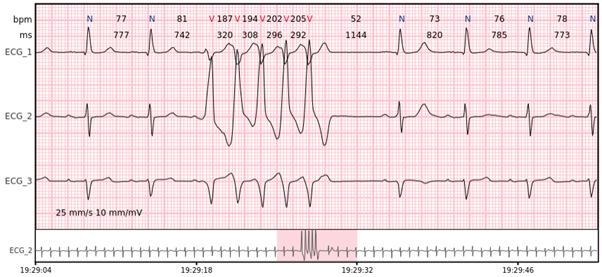
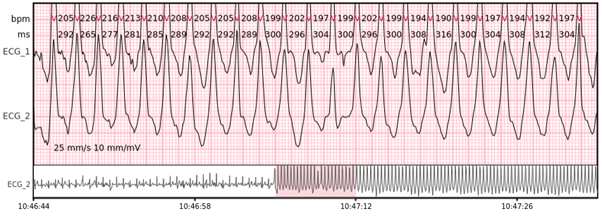
Ventricular tachycardia – more than 7 consecutive complexes originating from ventricles at a rate of > 100 bpm.
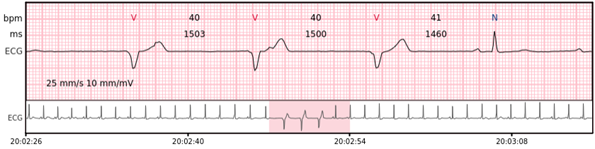
Idioventricular rhythm – 3 or more consecutive complexes originating from ventricles at a rate of < 50 bpm.
Accelerated idioventricular rhythm – 3 or more consecutive complexes originating from ventricles at a rate of 50 – 100 bpm.
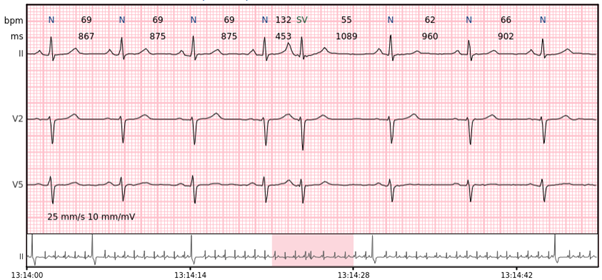
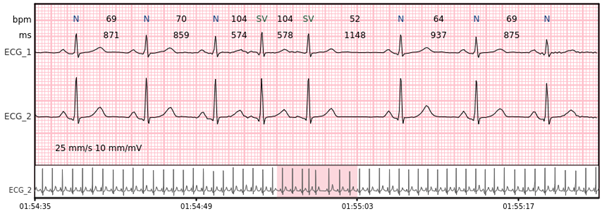
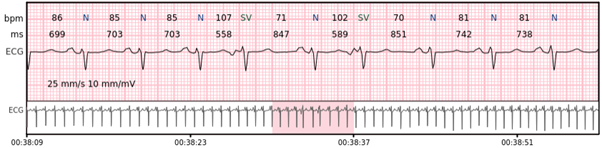
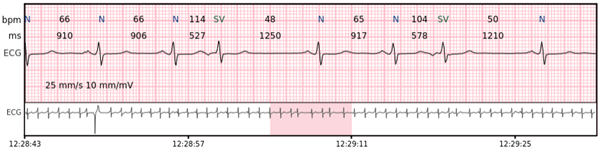
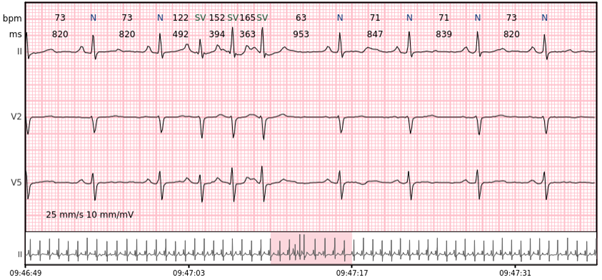
Supraventricular beats – premature complexes originating from outside of the ventricles (above the His bundle), usually characterized by the narrow QRS complexes ( < 110 ms) and changed P wave.
Supraventricular couplet – two supraventricular beats in a row.
Supraventricular bigeminy – every other beat is a supraventricular beat.
Supraventricular trigeminy – every third beat is a supraventricular beat.
Supraventricular salvo – 3-7 consecutive complexes of supraventricular beats at a rate of > 100 bpm.
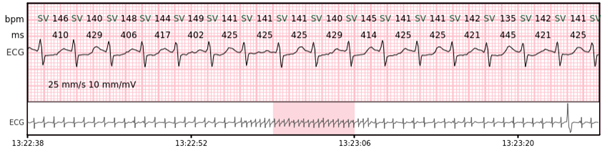
Supraventricular tachycardia – more than 7 consecutive complexes of supraventricular beats at a rate of > 100 bpm.
Supraventricular rhythm (SVR) – more than 3 supraventricular beats that do not meet the criteria for AF.
AFIB/AFL – atrial fibrillation or atrial flutter episodes.
AV blocks – 2nd degree and 3rd degree atrioventricular blocks.
An abnormal electrocardiogram can mean many things. Sometimes it is just a normal variation of one’s heart rhythm, which does not affect wellbeing nor health. Other times, an irregular recording can signal a medical emergency, such as a myocardial infarction or a dangerous arrhythmia. Quick and accurate ECG analysis, which you can obtain with Cardiomatics is all the more important now, to make timely and informed medical decisions.
In times when we are flooded with data, we especially need tools that help us identify crucial information and speed up the analysis by automating the process of interpreting ECG readings, which traditionally requires manual review by healthcare professionals. AI based algorithm, like Cardiomatics, can process large volumes of ECG data quickly and efficiently, enabling healthcare providers to analyze more recordings in a shorter amount of time. It also ensures consistent and standardized analysis by applying the same criteria to every ECG, minimizing variability between different healthcare professionals.
Overall, AI expedites ECG analysis by reducing manual effort, improving efficiency, and enabling timely detection of cardiac abnormalities, ultimately enhancing patient care and outcomes.
In Cardiomatics, we unlock the secrets of the heart’s rhythm and get one step closer to a future where cardiac care is personalized, proactive, and precise.
[1] Arrhythmia Recognition: The Art of Interpretation, T.Garcia, D.Garcia.